All posts by Jim Jackson

I am a geologist with experience in an international oil company. I taught for a number of years at Portland State.

Book Review: Mark Miodownik (2014) Stuff Matters

Mark Miodownik (2014) Stuff Matters: Exploring the Marvelous Materials that Shape our Man-Made World (Houghton-Mifflin).

Mark Miodownik, a professor of materials science at University College London, has written a delightful book for the general reader on some of the everyday materials we easily take for granted. Some are very common and well known: steel, paper, cement, chocolate, plastic, glass, pottery. Some are less common: aerogel, graphene, titanium.

Personal anecdotes are woven into the story of each material, beginning with a stabbing on the London Underground in 1985. The wound was made with a razor blade, which leads Miodownik into a meditation on the nature and history of stainless steel. (Yes, the author survives the attack by jumping onto a train.)

Celluloid, the clear plastic that made the movie industry possible in the 19th and 20th centuries, is presented within a movie script. The story begins with an accidental bar room murder in San Francisco and concludes with a fire in New York that consumes an office building. Much occurs between the beginning and the end.

Tea is staple of British life that was first imported from China. Porcelain was also imported from China where it was invented during the Eastern Han Dynasty, about 2000 years ago. The process that creates porcelain was a tightly held secret in China until 1704 AD, when the King of Saxony imprisoned Frederick Bottger, an alchemist. The King told Bottger that he would remain in prison until he discovered a means of making porcelain. You will find the rest of this story on page 188.

You may prefer to drink chocolate from your parcelain cup. Did you know that “chocolatl”, the original Mesoamerican drink, was used in ceremonies and as an aphrodisiac? Or that “chocolate” translates as “bitter water”? The various sensations we experience while chocolate melts in our mouth is due to more than a few  simply processed cocoa beans.

In addition to the anecdotes, history, and uses of the materials discussed by Miodownik, there are clear descriptions of the materials at the molecular and even sub atomic levels. As the author writes, “The central idea behind materials science is that changes at these invisibly small scales impact a material’s behavior at the human scale”. This book makes this idea clear in ways that are instructive and amusing.

After reading this volume, I look at coffee cups, razors, chocolate, and many other things in a new way. Stuff Matters shows us exactly what the title says: stuff matters.

The November 2014 OPEC Meeting

OPEC concluded the November meeting last week by agreeing to leave their production quota unchanged. A press release was issued after the meeting: http://www.opec.org/opec_web/en/press_room/2938.htm

The most important paragraphs read:

The Conference reviewed the oil market outlook, as presented by the Secretary General, in particular supply/demand projections for the first, second, third and fourth quarters of 2015, with emphasis on the first half of the year.  The Conference also considered forecasts for the world economic outlook and noted that the global economic recovery was continuing, albeit very slowly and unevenly spread, with growth forecast at 3.2% for 2014 and 3.6% for 2015.

The Conference also noted, importantly, that, although world oil demand is forecast to increase during the year 2015, this will, yet again, be offset by the projected increase of 1.36 mb/d in non-OPEC supply.  The increase in oil and product stock levels in OECD countries, where days of forward cover are comfortably above the five-year average, coupled with the on-going rise in non-OECD inventories, are indications of an extremely well-supplied market.

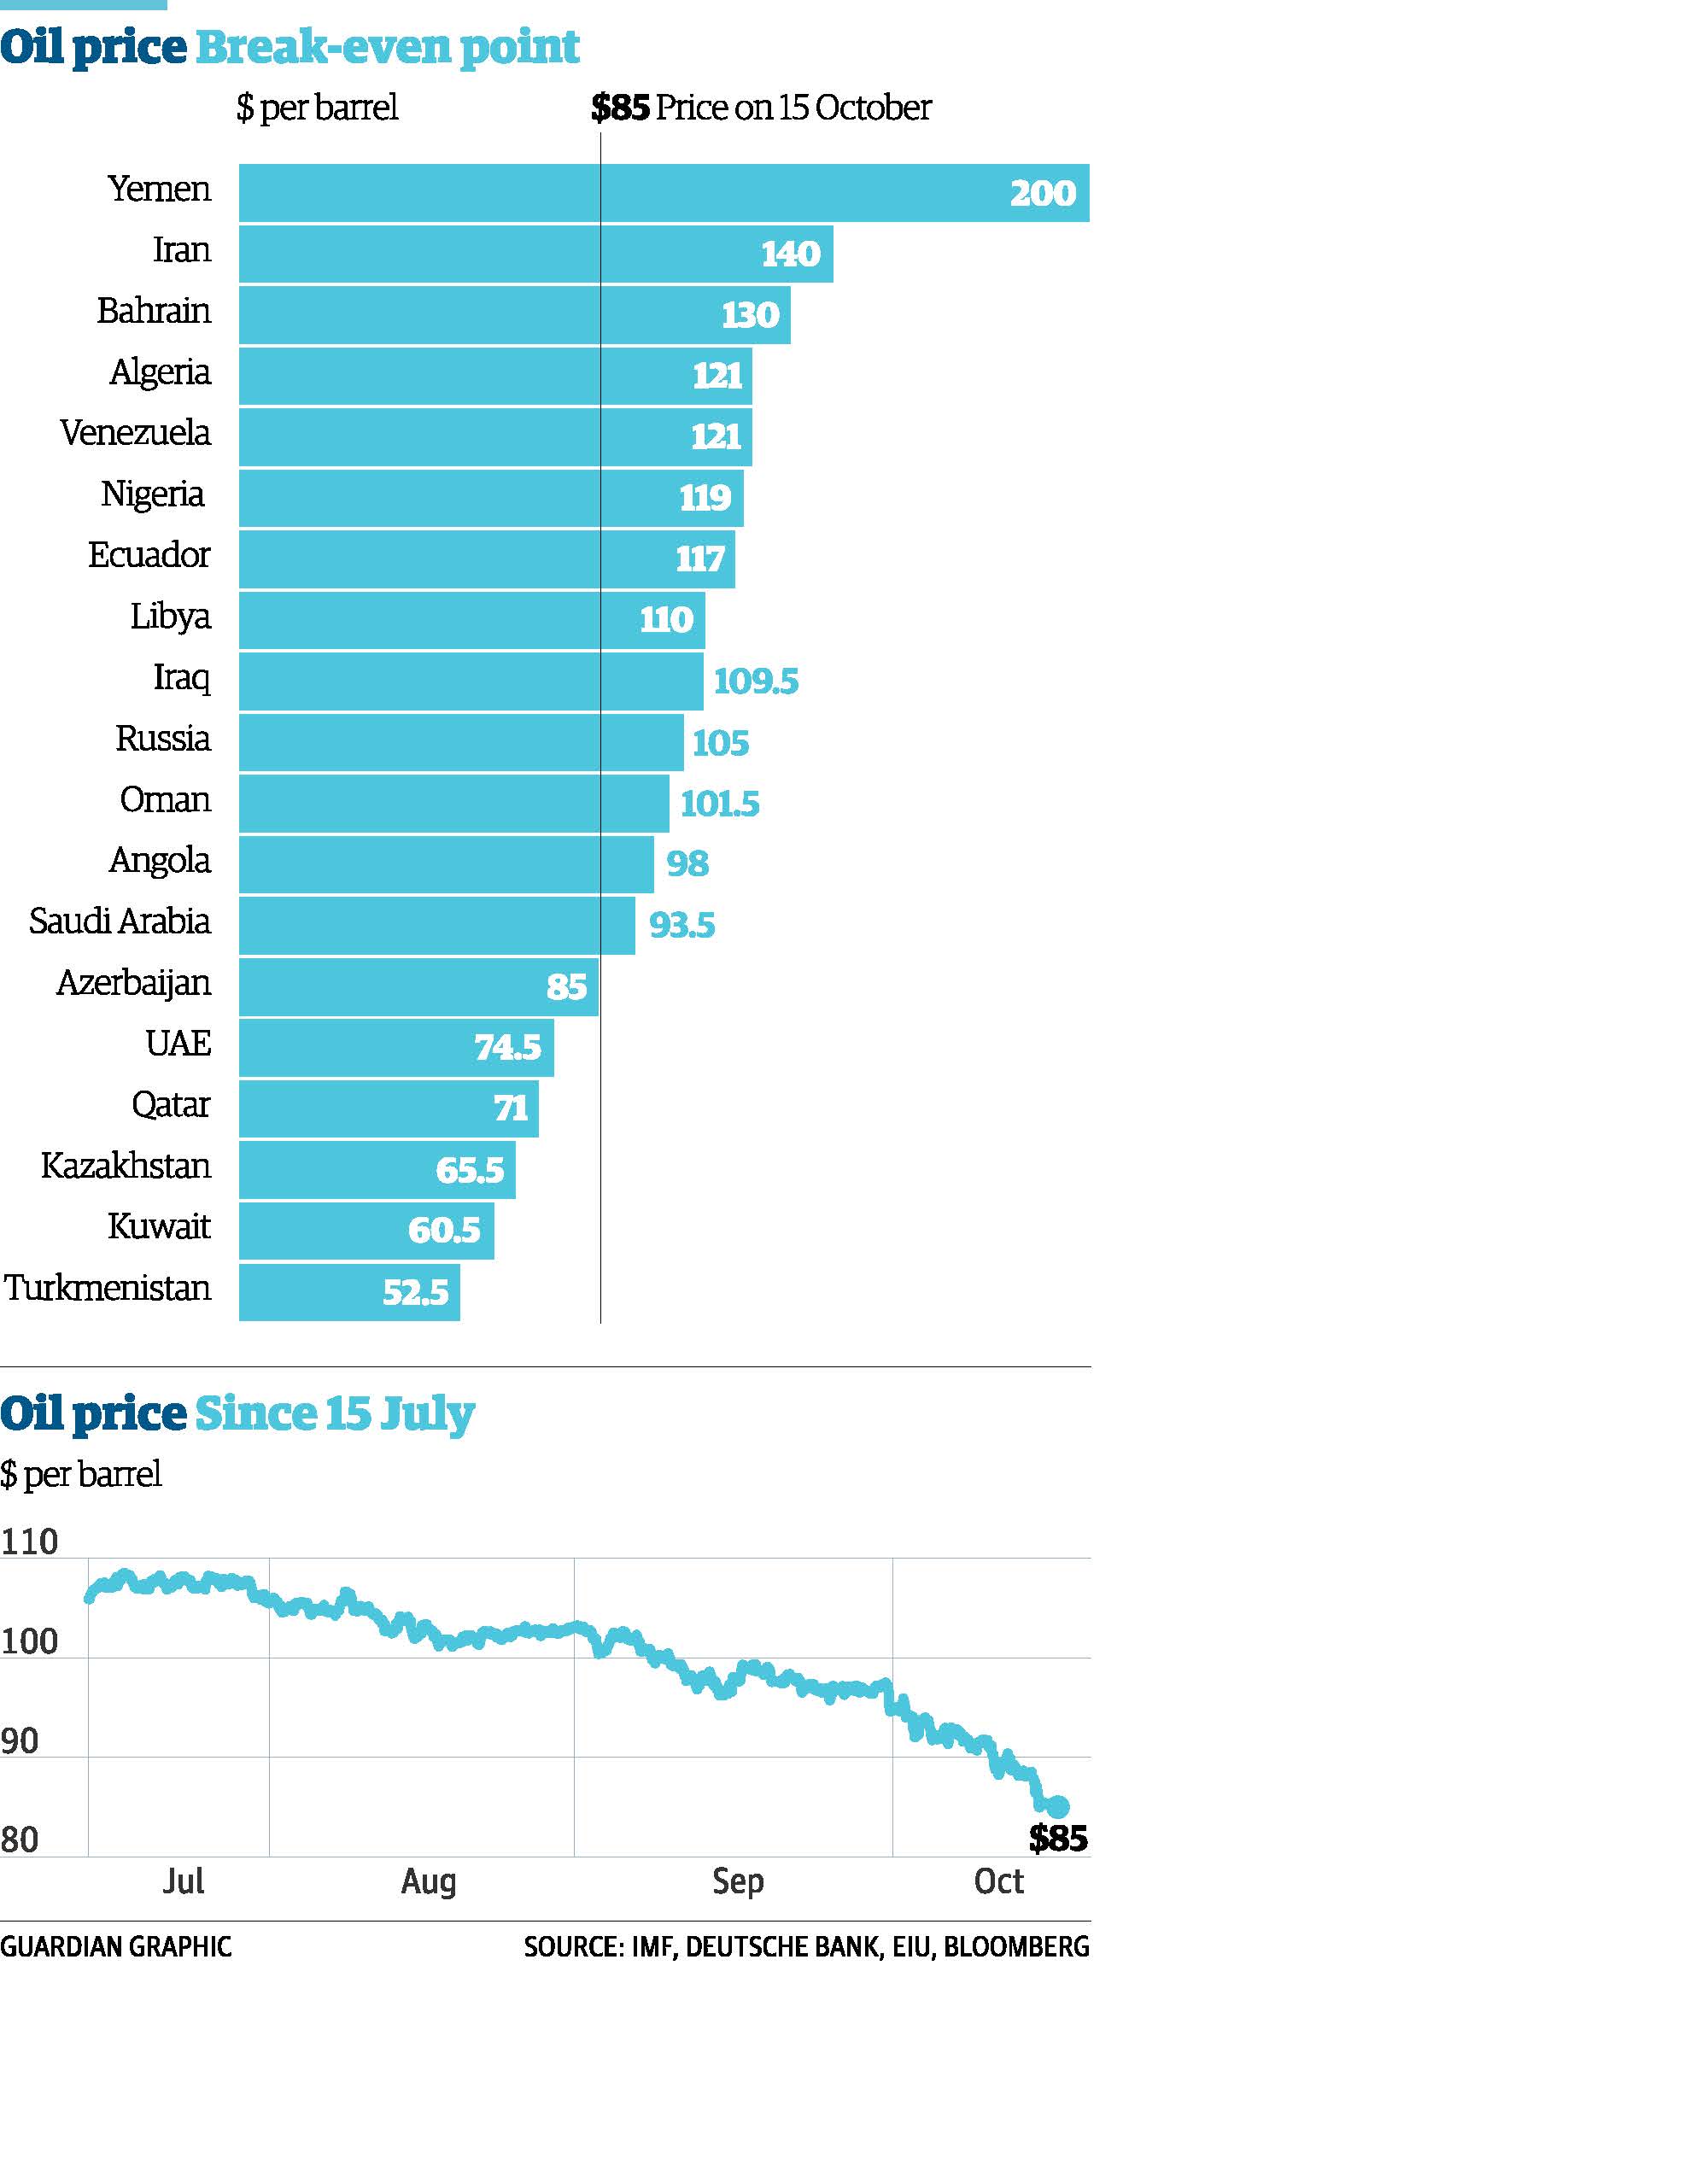
Recording its concern over the rapid decline in oil prices in recent months, the Conference concurred that stable oil prices – at a level which did not affect global economic growth but which, at the same time, allowed producers to receive a decent income and to invest to meet future demand – were vital for world economic wellbeing.  Accordingly, in the interest of restoring market equilibrium, the Conference decided to maintain the production level of 30.0 mb/d, as was agreed in December 2011. 

The New York Times, Financial Times, and other news sources report some disagreement among OPEC’s members about this decision. Some countries, such as Algeria, Iraq, Venezuela, and Nigeria,  would prefer to reduce production in order to raise the spot price. Presumable the reduction would be made by Saudi Arabia.

The Saudis are unwilling to do this, which has produced some speculation about their motives at this time. One line of thought is that the Saudis are in league with the US government: by driving down the price of oil, the Russian Ruble declines and Russian foreign income declines. The other line of thought is that the Saudis wish to preserve their sales to the US.

I prefer the latter scenario, which echoes the dispute between Venezuela and Saudi Arabia from 1998 to 2001. At that time oil production increased in Venezuela due to a field reactivation program executed by PEDEVSA, the state oil company. The program was first announced in 1989 and required several years to come into effect. Under this program, international oil companies (EXXON, BP, and so on) entered into contracts to improve production from existing fields and to explore for new fields within defined concession areas. The resulting increased oil production entered the US market, displacing Saudi exports to the US.

Saudi Oil Imports

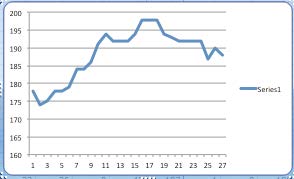
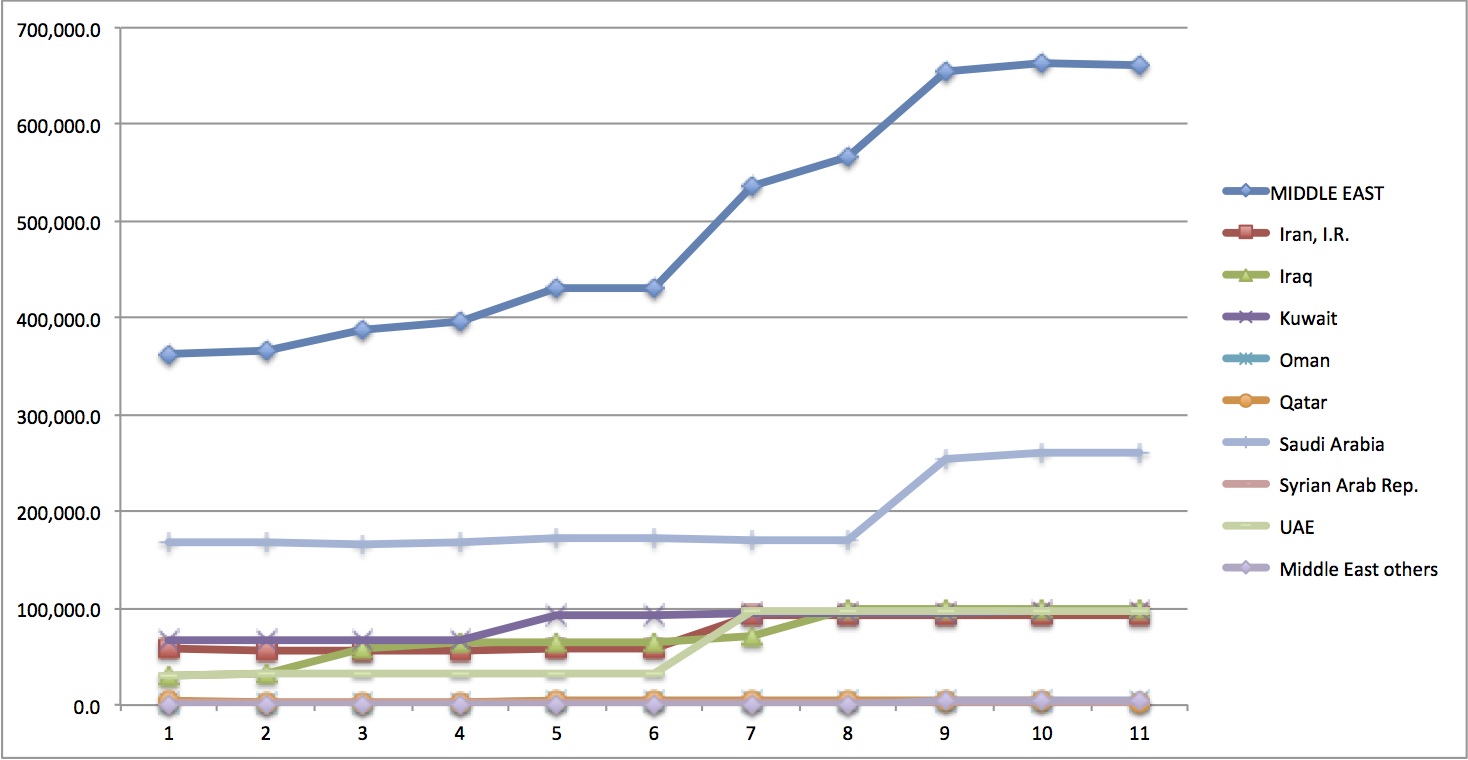
The chart above shows Saudi oil imports to the US from 1990 to 2014. Common wisdom in some quarters is that the Saudis want to export one million barrels per day to the US as a matter of foreign policy. The decline at the beginning of the period represents the displacement of Saudi imports by Venezuelan imports. The steep increase between 1999 and 2002 represents the increase in Saudi production intended to reduce the price of oil and remove more expensive Venezuelan crude from the US market. The steep fall at the end of the chart represents the displacement of Saudi crude by US shale oil production, primarily from the Bakken Formation in North Dakota.


chart-2


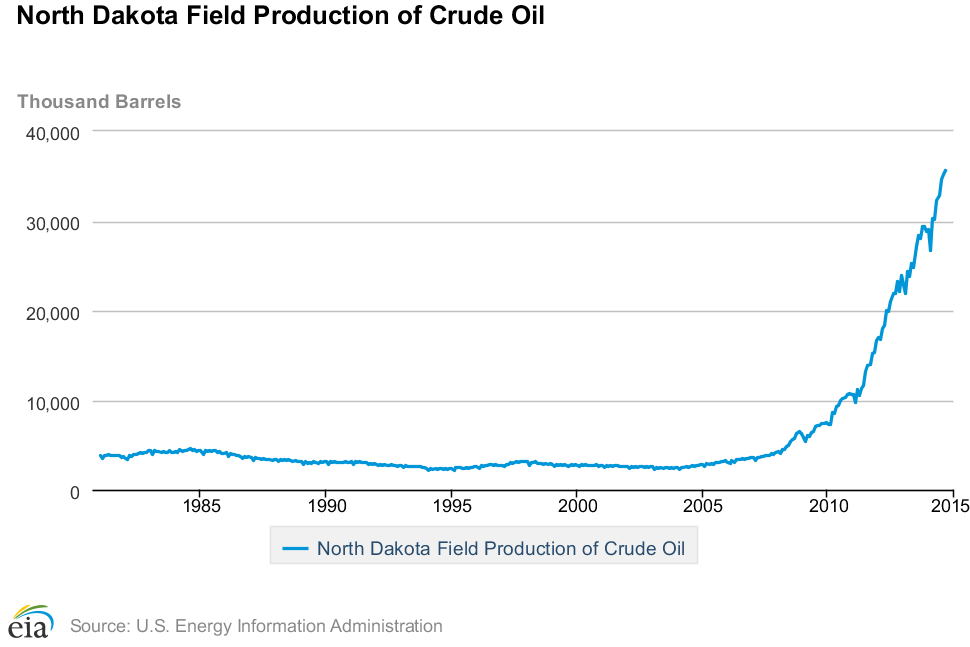
This chart shows oil production from North Dakota between 1990 and 2014. The steep increase in production beginning in 2008 represents new shale oil production from the Bakken Formation.

Why did the Saudis wait six years to respond to the increase in Bakken production? Between 2008 and 2012 Bakken production replaced declining oil production within the US, primarily from the Alaska North Slope fields. During the past two years, increasing Bakken and Eagle Ford oil shale production has exceeded field declines elsewhere in the US. Some foreign oil was displaced by the increase in US production, and some of the oil was imported from Saudi Arabia.

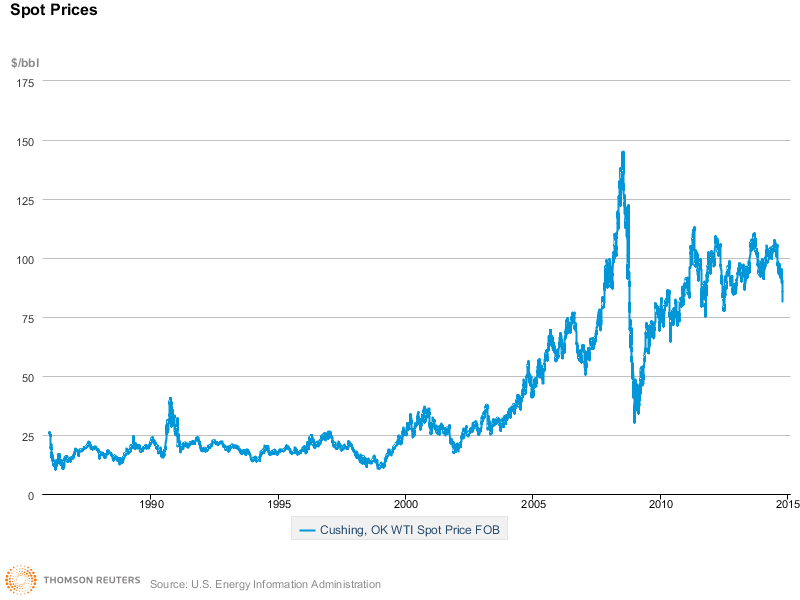
Today West Texas Intermediate crude oil closed down 94 cents at $65.84/barrel. The price of oil has been declining for several months, as noted in earlier posts. How much lower can it go before oil shale wells are shut in?

Only the well operators know the answer to this question, and it varies for each well. These shale oil wells begin production at a high daily rate, but after a three to nine months the production rate declines rapidly. Once the price oil sinks below the cost of shale oil production, we can expect a fairly rapid fall in production over the course of year or so. During this time, oil imports will likely rise.

There is a leading indicator for those looking at the shale oil play from the outside: the rig count. When operators decide there is no financial incentive to drill new production wells, they stop contracting drilling rigs.  Baker Hughes publishes a survey of rigs every week:

http://phx.corporate-ir.net/phoenix.zhtml?c=79687&p=irol-rigcountsoverview

For reference, below is a chart of recent North Dakota rig counts:

Bakken 6Jun14 to 4 Dec14

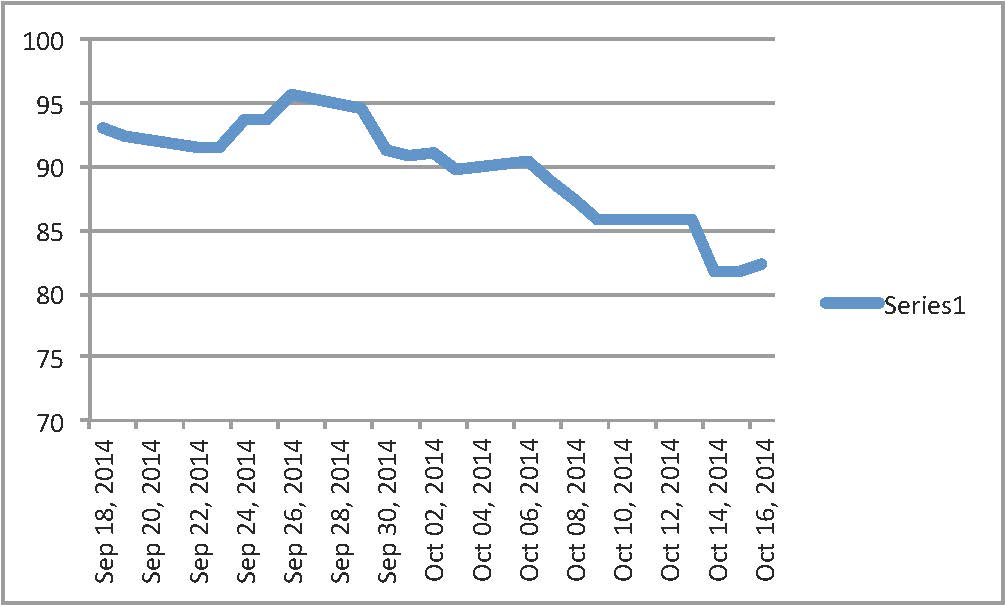
The above chart shows the number of rigs operating in North Dakota from June 6 to December 4, 2014. Good weather during the spring and summer typically results in an increase in rig use. Winter weather typically impedes the movement of both rigs and supplies to new drill sites, so the rig count declines.

For context, here is a longer term view of North Dakota rig counts:

Bakken Wells 4Feb11 to 5Dec14 2014

This chart shows the rig count in North Dakota from March, 2011 to December, 2014. The peak in rig count reflects the entry of new players as operators realized there was a resource to exploit in 2012-2013. The interesting question over the coming months is this: if the price of oil falls, will these operators stop drilling wells? Will the rig count fall dramatically?


The Recent Decline in Crude Oil Prices

The price of crude oil has recently fallen from over $100/barrel to below $85/barrel.

chart

As the chart shows, for many decades the price of oil was below $50/barrel until the turn of the century, when the price rose over the course of ten years to a peak above $115/barrel. The price fell dramatically during the 2008-2009 recession. Until a few weeks ago it increased from below $40/barrel to a recent average close to  $100/barrel. The one hundred dollar barrel appeared to be the “new normal”, which encouraged US companies to pursue shale oil in North Dakota and more recently in the Texas. A few weeks ago the price started to fall:

WTI mid Sep-mid Oct 2014

This chart show the price of West Texas Intermediate (WTI) crude at the Cushing, Oklahoma terminal. Is this a trend that will continue? Why has it occurred? Who will benefit? These questions have been addressed by news articles and op ed pieces in a variety of outlets. National Public Radio aired a report on Saudi Arabia’s possible role in the fall of prices

http://www.npr.org/2014/10/16/356588376/crude-oil-prices-drop-as-saudis-refuse-to-cut-production

Thomas Friedman’s column in the NY Times suggests the Saudi’s are driving the price down through high production in order to reduce US shale oil production and to damage Iran’s ability to support Shia militants:

He also suggests that perhaps the US and the Saudi’s want to damage Russia’s economy by reducing its revenues from oil exports.

The Financial Times, the Wall Street Journal, and many other papers have run similar stories. Many stories claim that the decline in economic activity in Europe and China during the past six months hasreduced demand for oil, and thus caused the price to fall since the beginning of the year. Is this true?

Regarding China’s oil consumption, Platt’s reports that China has imported 7.4 percent more oil for the 12 months ending September 30 than it did a year earlier. China’s average import was 6.74 million barrels of oil per day. This was 13 percent higher than in August, 2014.

http://www.platts.com/latest-news/oil/singapore/chinas-september-crude-oil-imports-rise-7-on-27719307

Regarding Europe, the International Energy Agency (IEA) reported in September that first quarter 2014 consumption was 13.7 million barrels per day (mmbpd), second quarter consumption was 14.1 mmbpd, and third quarter was estimated to be 14.6 mmbpd.

Falling demand in China and Europe is not depressing prices.

The IEA also reports falling supplies in August. These are due in part to seasonal maintenance in several producing countries, and a smaller call for deliveries of crude from Saudi Arabia.

http://www.iea.org/oilmarketreport/omrpublic/currentreport/#Supply

Economic data is always retrospective. Reports of production and consumption arrive well after the crude has been pumped from wells or delivered to refineries. In a few months we will have a better idea how much oil is being supplied and consumed this autumn.

What happens if crude oil prices remain low? This topic also generates opinion pieces. The Guardian had piece with one interesting graphic:

break even oil_prices


http://www.theguardian.com/news/datablog/2014/oct/16/datablog-low-oil-prices-chill-producer-economies

The bar graph at the top of figure shows the price of oil needed for producers to break even in 19 exporting countries. Published on October 15 when the price for WTI was near $85/barrel, it shows that Iran loses perhaps $50/barrel. Iran produces oil from a number of fields, and no doubt some fields break even below $85/barrel. But the chart indicates that some, perhaps most, of Iran’s fields will lose money if recent prices persist. Likewise, Russia loses about $20/barrel at recent prices. However, Russia produces oil from many fields. No doubt some fields lose money at recent price levels, but others will remain profitable. Low prices will damage Russia’s foreign income.

As for Saudi Arabia, if it does play an active, deliberate role in driving prices down, it has some fields that lose money, but most will make money. With substantial foreign reserve holdings, it may be able to live with low prices for a longer period of time than other members of OPEC.

As for US oil shale, the cost of lifting a barrel of crude vary within basins from $60 a barrel to $80 a barrel. If low prices persist, then investors in US shale projects will find less comfort with these project than when the price was a the “new normal” of $100 a barrel. As the perception of risk in shale oil projects rises, some investors will look for projects in other fields.

OPEC energy ministers will meet in Vienna on November 27. Statements made before and after meeting may provide some guidance about future production trends. These statements may hint at political conflicts between member states, and between OPEC members and other producing countries.


The People’s Climate March-How Big is the Problem?

The New York Times, among many other news outlets, reported on the September 21 People’s Climate March:

I have nothing to add to these reports, and nothing to report about the much smaller march in Portland, Oregon:

http://koin.com/2014/09/21/climate-march-in-portland-hold-polluters-accountable/

Climate change is a serious problem that needs to be addressed. The changes in atmospheric composition since the industrial revolution have created a greenhouse effect, as predicted by Svante Arrhenius. The principle gasses contributing to the effect are carbon dioxide and methane. The largest human made source of carbon dioxide is due to the combustion of coal, oil, and natural gas. Significant methane releases are due to production and handling of these fuels.

How much of these fuels does the US use? What are they used for? The DOE’s Energy Information Agency compiles data from which two figures are published each year.

http://www.eia.gov/totalenergy/data/monthly/previous.cfm

US Total Energy 2013

The figure shows sources of energy used during 2013 in the US. Natural gas is the largest source at 24.80 quadrillion BTU (quads). Petroleum Imports is the second largest at 21.09 quads. “Petroleum Imports” refers to crude oil, natural gas condensate, and all refined products, including gasoline, diesel fuel, bunker fuel, etc. Coal is the third largest source at 19.99 quads. US crude oil production is fourth at 15.77 quads. Natural gas liquids (NGPL) is a minor energy source at 3.47 quads. Nuclear power provides 8.27 quads, and renewable energy (hydropower, biomass, geothermal, solar/photovoltaic) provide 9.3 quads.

The chart shows that some energy is exported, a total of 11.80 quads. Thus the total US energy supply in 2013 was 97.53 quads. Fossil fuels supplied 79.79 quads, or about 82 percent of US energy. Replacing a significant fraction of these fossil fuel supplies is a daunting task.

Where does the US use these energy. The EIA supplies a figure for this too:

US Energy Flows 2013

As this figure shows, transportation uses 26.9 quads. Petroleum supplies 92 percent of transportation energy. Transportation uses 28 percent of US energy.

Industry, including manufacturing, heating and electricity for factories, uses 21.5 quads, or 22 percent of US energy.

Stores, houses, and apartments account for 10.7 quads, or 11 percent of total US energy.

Electric power generation is the largest user of energy in the US at 38.4 quads, or 39 percent of total US energy. Over 90 percent of coal is used for electric power generation.

Natural gas is used in three sectors of the economy in almost even quantities: 34 percent by industry, 31 percent in electric generation, and 32 percent for heating houses, apartments, and stores.

Reducing crude oil consumption calls for a radical change in the US transportation system. Reducing coal consumption in favor of renewable energy calls for an equally radical change in the production of electricity. Reducing natural gas consumption calls for changes in almost every sector of the economy.

These two charts make one thing clear: there is no easy solution to the US carbon dioxide and methane emissions problem.

Oil Price Forecasts: An Example from 1983


The Hubbert peak oil forecast assumes the production of oil (or gas or other commodities) follows a logistics curve from initial production to final resource exhaustion. The area under the “Hubbert Peak Oil” curve represents the total oil to be produced, or the total oil resource that has and will be exploited. The curve represents the volume of oil produced per unit time. In most forecasts, years or decades represent the unit time. We can read the curve as barrels of oil produced per year or per decade.


Economists consider supply and demand to be functions of price. The volume of a product consumed in day or a year or other time period is thus considered to be a function of the average price for that time period. If we want to perform a forecast of peak oil or ultimate oil consumption for a oil producing province, or a country, or the world, then we would like to have a forecast of the oil price for the remaining history of oil production. This is a difficult problem. Consider an example from 1983:

BrentPrice

The figure shows a price forecast made by a major oil company. It was used to evaluate potential projects in a variety of basin and countries. It was also used to forecast company revenues from existing production. Discussions with colleagues working in  other companies and host governments at the time suggested that this scenario was similar to scenarios used throughout the industry.

At the time of the forecast, Brent crude traded for about $30 a barrel. Although the price was forecast to remain flat for a few years, by 1986 it was expect to begin rising modestly each year until about 1997. From then until the end of the forecast period, it was forecast to rise to $120 a barrel.

The figure shows the actual price oil in nominal terms through 2011. The nominal price of oil fell to below $20 a barrel for 16 years, with only a few brief intervals above $20. It reached its nadir in December, 1998 at less than $10 a barrel. (http://www.eia.gov/dnav/pet/hist/LeafHandler.ashx?n=PET&s=RBRTE&f=M)

From then it rose, with one pause, to over $100. Although it never averaged $120 per barrel for an entire year, it did average over $120 a barrel in April 2011 and March 2012.

Nominal prices do not reflect inflation. For much of the forecast period inflation fell, becoming quite low in recent years. Using the CPI to discount the nominal price to 1983 dollars shows the price never came close to $100 a barrel, and has only recently approached $50 a barrel in 1983 dollars.

From today’s perspective, the error in the 1983 forecast may seem obvious. Oil production was increasing in North America and the North Sea at that time. OPEC members were cheating on their quotas. The high oil prices of the previous decade led to increased transportation fuel efficiency, as well as fuel substitution in many sectors of the economy.

In 1970, however, it seemed that oil would remain below $5 a barrel for many years. The Arab oil boycott just a few years later was not foreseen. For many years a nominal price above $3 a barrel seemed far fetched.

Not knowing the future price of oil, it is very problematic to assume the future production of oil will follow a simple logistic curve. This should give pause to those who predict either a near term collapse in production or a future with abundant supplies.


The Problem with OPEC Reported Reserves

MEOilReserves OPED

The Organization of Petroleum Exporting Countries (OPEC) uses the share of total proven reserves to allocate production quotas among its members. The proven reserves are reported by each member country to OPEC. The country with the largest reserves is granted the largest share of the quota. From the founding of OPEC, Saudi Arabia has reported the largest oil reserves.

The figure at the top of this post is an Excel graph made from data reported by OPEC for the entire world. The spreadsheet is found here:

http://www.opec.org/library/annual%20statistical%20bulletin/interactive/2004/filez/XL/T33.HTM

The units shown on the vertical axis are in thousands of barrels of oil. The horizontal axis shows eleven years from 1980 thru 1990. Between 1983 and 1984, Kuwait’s reserves jump from 67 billion barrels to 92.7 billion barrels. The Wafra oil field was discovered in 1984 and accounts for this increase.

Between 1985 and 1986 Iran’s reported reserves jumped from 59 billion barrels to 92.86 billion barrels. Iraq’s oil reserves jumped from 72 billion barrels to 100 billion barrels. Iran and Iraq were engaged in a protracted land war between 1980 and 1987, hindering exploration in both countries.

The United Arab Emirates reserves jumped from 32.9  to 97.2 billion barrels. Between 1987 and 1988 Saudi Arabia reported reserves jumped from 169.6 to 255 billion barrels.

These very large oil reserve additions should reflect the discovery of very large oil fields.  Although a number of discoveries were reported during the 1980’s, none approach the size of pre-1980 discoveries. So perhaps the increased reserves reflect improved oil recovery techniques.

Skeptics hold a different view.  Consider the oil price history reported by the EIA for this period:

http://www.eia.gov/dnav/pet/hist/LeafHandler.ashx?n=pet&s=isa4990008&f=a

The average price of Saudi light crude landed in the US in 1982 was $35.65/barrel. In 1985 it was $25.35/barrel. In 1986 it was $13.05/barrel. In 1988 it was $14.04/barrel. The skeptics claim the increased reserves reported by OPEC countries, especially those in the Middle East, were not due to major discoveries or improved recovery techniques.

The skeptics claim the reports were a response to declining oil sales revenues. The falling oil prices reduced oil revenues, so OPEC agreed to reduce its production in order to restore higher oil prices.  Rather than accept lower production quotas, member states increased their reported reserves in order to obtain larger shares of the reduced quotas. As their reports are not audited by OPEC, no one outside of the state oil ministries really knows what their proven oil reserves are.

And without a reliable estimate of proven global oil reserves, it is not possible to perform a global peak oil forecast using the method employed by M. King Hubbert.

The Peak Oil Problem

Hubbert Slide


“Peak Oil” is a topic that returns to public view whenever the price of oil increases above its most recent price range. The concept of peak oil is often credited to M King Hubbert, a geologist who worked for Shell Oil in Houston for half of his career, and then worked for the USGS for the second half of his career. He saw oil supply forecasts as a planning tool to be used by Shell’s management. At the USGS he saw the forecasts as a useful strategic planning tool to be used by US policy makers. His USGS forecast was rejected by resource assessment geologists within the Survey. He predicted a peak of oil production from conventional oil fields in the Lower 48 states and near shore waters to occur in 1970. This did occur, and subsequently his forecasts for both US and global production gained a wide audience, including both supporters  and skeptics.

The lower 48 forecast was made after many decades of production using a database compiled from a major producing company. Hubbert had access to a reasonably complete knowledge of region’s geology, production techniques, and production history.

A similar knowledge base does not exist does to support a global forecast, as Hubbert knew very well. The figure shown above is modified from Hubbert’s prediction of global oil production from conventional oil fields made in 1969. The dark green area shows global production from 1900 to 2000 as compiled by Ron Charpentier of the USGS resource assessment group in Denver. The light green area shows proven reserves as reported by oil companies and national governments in 2000. These data are compiled by British Petroleum and published every year. The yellow area shows an estimate of undiscovered reserves estimated by the USGS as of 2000. The estimate is the mean of a forecast that ranges from very likely to be discovered ie more than a 95% of being discovered, to very unlikely of being discovered ie less than a 5% chance of being discovered.

There is little discussion regarding the quantity of oil produced to date in the figure. The volume is so large that unreported production would not change the graph. There is some real doubt as to the quantity that is proven but not produced. The doubt arises from the nature of the OPEC production quota setting process. Some observers do not believe all of the reports issued by OPEC members. Finally, the volume of oil to be discovered in the future is unknown. The technology and estimating processes simply do not provide a narrow estimate of future discoveries.

The “peak oil problem” thus seems to be a debate over the quantity of proven reserves and undiscovered oil. If you know these estimates, you simply plug in the total oil endowment of the planet into an equation, and a forecast results. If you disagree with other forecasters’ estimates of these volumes, then your forecast will differ from their forecasts.

But is this all there is to the peak oil problem? What about the curve that rises from zero, reaches a peak of some duration, and then falls to zero? This is an example of a logistics curve, which can be represents a differential equation. Hubbert expressed some doubts about this mathematical model for oil production. Note the historic production trend shown by the dark green area. Production rises and falls from 1900 to 2000. Some production changes reflect increasing supplies. Some changes reflect disruptions caused by economic recessions and wars. At every point in time on the historic production curve (the dark green area), the quantity produced and consumed reflects the effect of price on supply and demand. This raises an important question: can we predict the price of oil in the distant future? Can we predict the price of oil five, ten, 50 years from now? Can we relate such predictions to resulting future supply and demand?

The “Peak Oil Problem” is a problem with four variables, two or perhaps three of which cannot be known. We can agree on the volume of oil produced to date. There is some disagreement about the volume of discovered oil that has not been produced yet. We really don’k know how much oil will be discovered in the future. And no one has been able to predict the price of oil into the future. Many failed oil companies and commodity traders attest to this last fact.


Consuming the Earth

The entries in the blog will discuss diverse topics in economic geology. “Economic Geology” is the subset of geology addressing the extraction industries. These include metallic ore mining, oil and gas, coal, sand and gravel, and so on. The “economic” in this subject includes the supply and demand behind these activities, as well as the mineral rights that make them possible. The surface of the Earth is geologically heterogeneous, and inevitably this leads to trade between different regions. The activities require capital, in some cases billions of dollars. Project finance thus finds its way into this subject.

Entries will be posted as time and circumstances permit.